Since 1995 Transparency International compiles and updates the Corruption Perception Index (“CPI”) on a yearly basis. The CPI measures the perceived level of corruption in the public sector worldwide and serves to raise awareness of corruption as well as to encourage national governments to take action against it. Hence he CPI is regarded as one of the most important indicators for assessing the risk of corruption. The CPI 2018 was published on January 29, 2019 (link to our blog article).
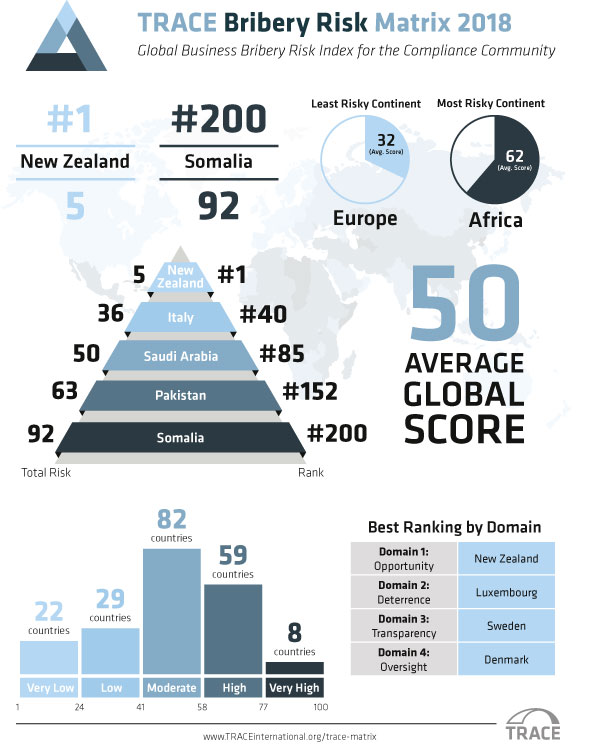
However, the CPI’s rating is solely based on the perception of the local corruption risk – without taking into account other risk-increasing or risk-decreasing factors. In light of all potential risk drivers of a country’s corruption risk, an isolated view on the CPI only may not be sufficient. Another index considering different risk factors applicable to the evaluation of a country’s corruption risk is the TRACE Bribery Risk Matrix published by TRACE International since 2014 (last published on December 6, 2018 for the year 2018) (“Bribery Risk Matrix”).
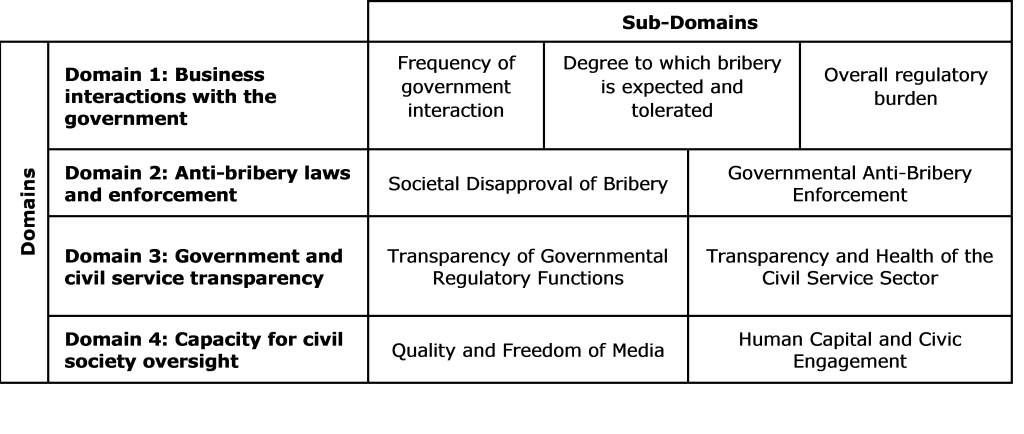
The Bribery Risk Matrix not only takes into account the perceived risk of corruption in a country, but also classifies the abstract country-specific corruption risk in different dimensions using four domains and nine sub-subdomains:
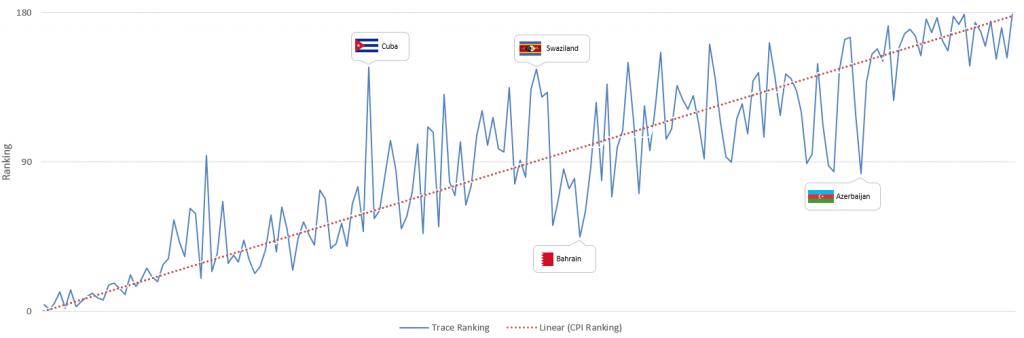
Due to the evaluation and ranking method the Bribery Risk Matrix is based on and the consideration of additional risk factors, the comparison between the ranking set out by the current Bribery Risk Matrix and the CPI 2018 results leads to partially surprising deviations:
- Because of the still very high degree of government interaction and the anti-corruption laws, that are perceived as ineffective, Cuba only ranks 165th in the TRACE analysis, while the CPI 2018 places Cuba on position 61.
- Swaziland achieved 38 points and was ranked 89th in the CPI 2018. However, due to the perceived high expectation of bribes and the opaque government structures it was ranked 162nd only in the Bribery Risk Matrix.
- While Azerbaijan slipped from 122nd to 152nd rank in the CPI 2018, the country – with an almost constant risk score – improved from 112th to 95th rank compared to last year’s result of the Bribery Risk Matrix. Transparent government structures, solid anti-corruption laws and their appropriate enforcement are the main arguments used by TRACE International to substantiate the current ranking.
- In the CPI 2018 ranking Bahrain is located in the middle field and achieves rank 99 out of 180 whereas the Bribery Risk Matrix places the country with position 50 out of 200 under the top 20%. The decisive factors for the ranking are the expected low probability of corruption and the above-average and strict anti-corruption laws as well as their strict enforcement.
While in 2017 Sweden was ranked first place in the TRACE ranking, in 2018 New Zealand took over the leading position. Compared to the previous year, Germany was able to maintain eighth place, while the US slipped from 16th to 18th place. The US were downgraded due to a ten point increase in Domain 1 (Business interactions with the government). As already mentioned in our blog post relating to the CPI 2018, corruption in the US is perceived as an increasing problem both in the economy and among state institutions. Like the CPI, the Bribery Risk Matrix shows an increased business risk of corruption in Asian, African and South American countries, with Somalia and Venezuela – as in the previous year – each occupying one of the last three places in the ranking.
Overall, TRACE International rates 29 countries (14.5%) as “low risk” and 22 countries (11%) as “very low”, while 82 countries (41%) are deemed to be at “medium risk” level. In addition, 59 countries (29.5%) are qualified as “high risk” and even eight countries (4%) as “very high risk”.
What does this mean in practical terms: In addition to a mere country ranking, the Bribery Risk Matrix also provides a very good overview of the risk drivers relevant for the evaluation of country-specific business bribery risk. In particular, business relationships with countries that show deficits in one of the four domains or whose placement is conspicuous should be critically reviewed due to the increased risk of corruption in business transactions to be assumed.
Go to the Trace International Website.